



The Five KPIs Behind DME Analytics in 2026
Tracking the right KPIs is what turns the day-to-day activity of a DME business into something more measurable and manageable. Problems compound quietly if this step is skipped: a denial pattern goes unaddressed for a quarter, AR days drift one location upward at a time, and by the time anyone notices, the number is already a bigger fix than it needed to be.
The five metrics below cover the front end of the revenue cycle (is the claim clean before it leaves your building), the back end (how fast is it turning into cash), and the operational layer that sits underneath both (do you have the inventory to fulfill what you’re billing for). Track them individually, and you get five disconnected numbers. Track them in one dashboard with the full picture, and you get a working model of where your revenue cycle is actually leaking.
AR days (days in accounts receivable)
AR days measure the average time between billing a claim and collecting on it. Divide your current receivables by your average daily charge amount. HFMA puts the healthy range at 30 to 40 days, with A/R over 90 days kept below 10% of the total balance.
For a single-location provider, AR days is a straightforward number to watch. For a multi-location operation, the aggregate figure hides more than it reveals. A five-location provider sitting at a 35-day average could have one site running a clean 22 days and another sitting at 60, and the blended number won’t tell you which. You need AR days broken out by location, and ideally by payer, or you’re solving the wrong problem.
Clean claim rate
Clean claim rate is the percentage of claims accepted by the payer on first submission, with no errors, missing documentation, or eligibility issues. A strong, clean claim rate sits in the mid-90s or higher; anything meaningfully below that means your team is spending time on rework that automated pre-submission checks should be catching first.
The DME-specific complication is that “clean” depends on more than coding accuracy. A CMN that’s incomplete, a prior authorization that expired between order and delivery, or an HCPCS modifier that doesn’t match the payer’s current rules will all generate a denial that has nothing to do with how carefully your biller filled out the claim. Reviewing claims processing best practices by location surfaces whether a low clean claim rate is a training gap, a payer-rule change nobody caught, or a documentation bottleneck upstream of billing entirely.
Denial rate
Denial rate is the percentage of submitted claims a payer rejects, calculated by dividing the denied claim value by the total submitted claim value over the same period. HFMA puts the industry average between 5% and 10%, with anything under 5% considered optimal. More than half of U.S. healthcare organizations report denial rates above 10%, according to MGMA’s 2024 benchmarking report on denials and appeals, which means a lot of operators are treating a fixable problem as a fixed cost.
Denial rate matters less as a single number than as a pattern. Which payer is generating the most denials, and which HCPCS codes or equipment categories keep showing up?
Is one location driving a disproportionate share for a specific commercial payer? Those questions only answer themselves when denial data is centralized instead of siloed by site.
Inventory turnover
Inventory turnover tracks how efficiently your equipment and supply stock convert into fulfilled orders and revenue, rather than sitting on a shelf or in a truck. For rental assets specifically, turnover connects directly to billing: equipment that isn’t tracked accurately can sit unbilled after a return, or get redeployed before an inspection is logged.
There isn’t a single authoritative DME-wide turnover benchmark you can hold every category against — a CPAP supply line turns differently than a power wheelchair fleet. What matters operationally is tracking turnover by equipment category and by location, and watching the trend rather than chasing an external number. A location where turnover is dropping quarter over quarter has either a demand problem, a reconciliation problem, or both, and you want to know which before it shows up as a write-off.
Collections speed
Collections speed measures how quickly billed revenue actually becomes cash in hand, from the point of claim submission through remittance posting and, where relevant, patient payment. It’s the metric that ties AR days, clean claim rate, and denial rate together into a single outcome: Are you getting paid faster or slower than last quarter?
Automated billing workflows that handle eligibility verification, claims scrubbing, and remittance posting without manual re-entry are what actually move this number, and the effect shows up in practice, not just in theory: In-Home Respiratory saw a 20% improvement in collections speed after consolidating its billing workflow onto NikoHealth — a result tied directly to fewer manual touchpoints between submission and payment, not headcount changes.
Each of these five KPIs has its own definition, its own benchmark, and its own failure mode, which is exactly why they’re easy to track individually and hard to act on together. The table below pulls the benchmark and the first diagnostic step for each into one reference, so a billing manager or operations director can move from “this number looks off” straight to “here’s where to look,” without re-reading five sections to get there.
KPI | Healthy target | First place to check when it slips |
AR days | 30–40 days (HFMA) | Break out by location, then by payer, before assuming it’s a company-wide issue |
Clean claim rate | Mid-90s or higher | CMN completeness and prior authorization expiration dates |
Denial rate | Below 5% (HFMA) | Denial reason code by payer, then by location |
Inventory turnover | Steady or improving trend, not a fixed number | Return-to-inventory lag at each site |
Collections speed | Improving quarter over quarter | Manual touchpoints between claim submission and remittance posting |
Why Multi-Location Operators Need Centralized DME Analytics
Each KPI above is manageable at a single location, where one billing team and a shared spreadsheet are usually enough to keep things visible. That visibility gets harder to maintain once you’re running multiple sites, because a fix rarely travels on its own: a billing coordinator at location two might work out a way around a payer-specific denial, but if nobody documents it, location four ends up absorbing the same denial three months later, solving a problem the company already solved once.
This is the core case for centralized multi-location DME management: each of the five KPIs above compounds across locations once it’s invisible at the enterprise level. An operations director staring at five separate reports has to reconcile formats before any real comparison can start, turning what should be a quick check into an afternoon of exporting and matching columns. Analytics-driven HME/DME revenue optimization means removing that reconciliation step entirely, so the comparison across locations is the first thing that happens, not the last.
Building a DME Advanced Analytics Dashboard That Scales
A dashboard that scales past two or three locations needs a few specific capabilities, not just more charts. It needs to break every core KPI out by location and by payer, not just show a blended total. It needs denial and clean claim data close enough to real time that a billing manager can act on a pattern the same week it starts, not the following quarter. And it needs inventory and revenue cycle data living in the same system, because a rental billing error and an unlogged return are usually the same underlying event viewed from two departments.
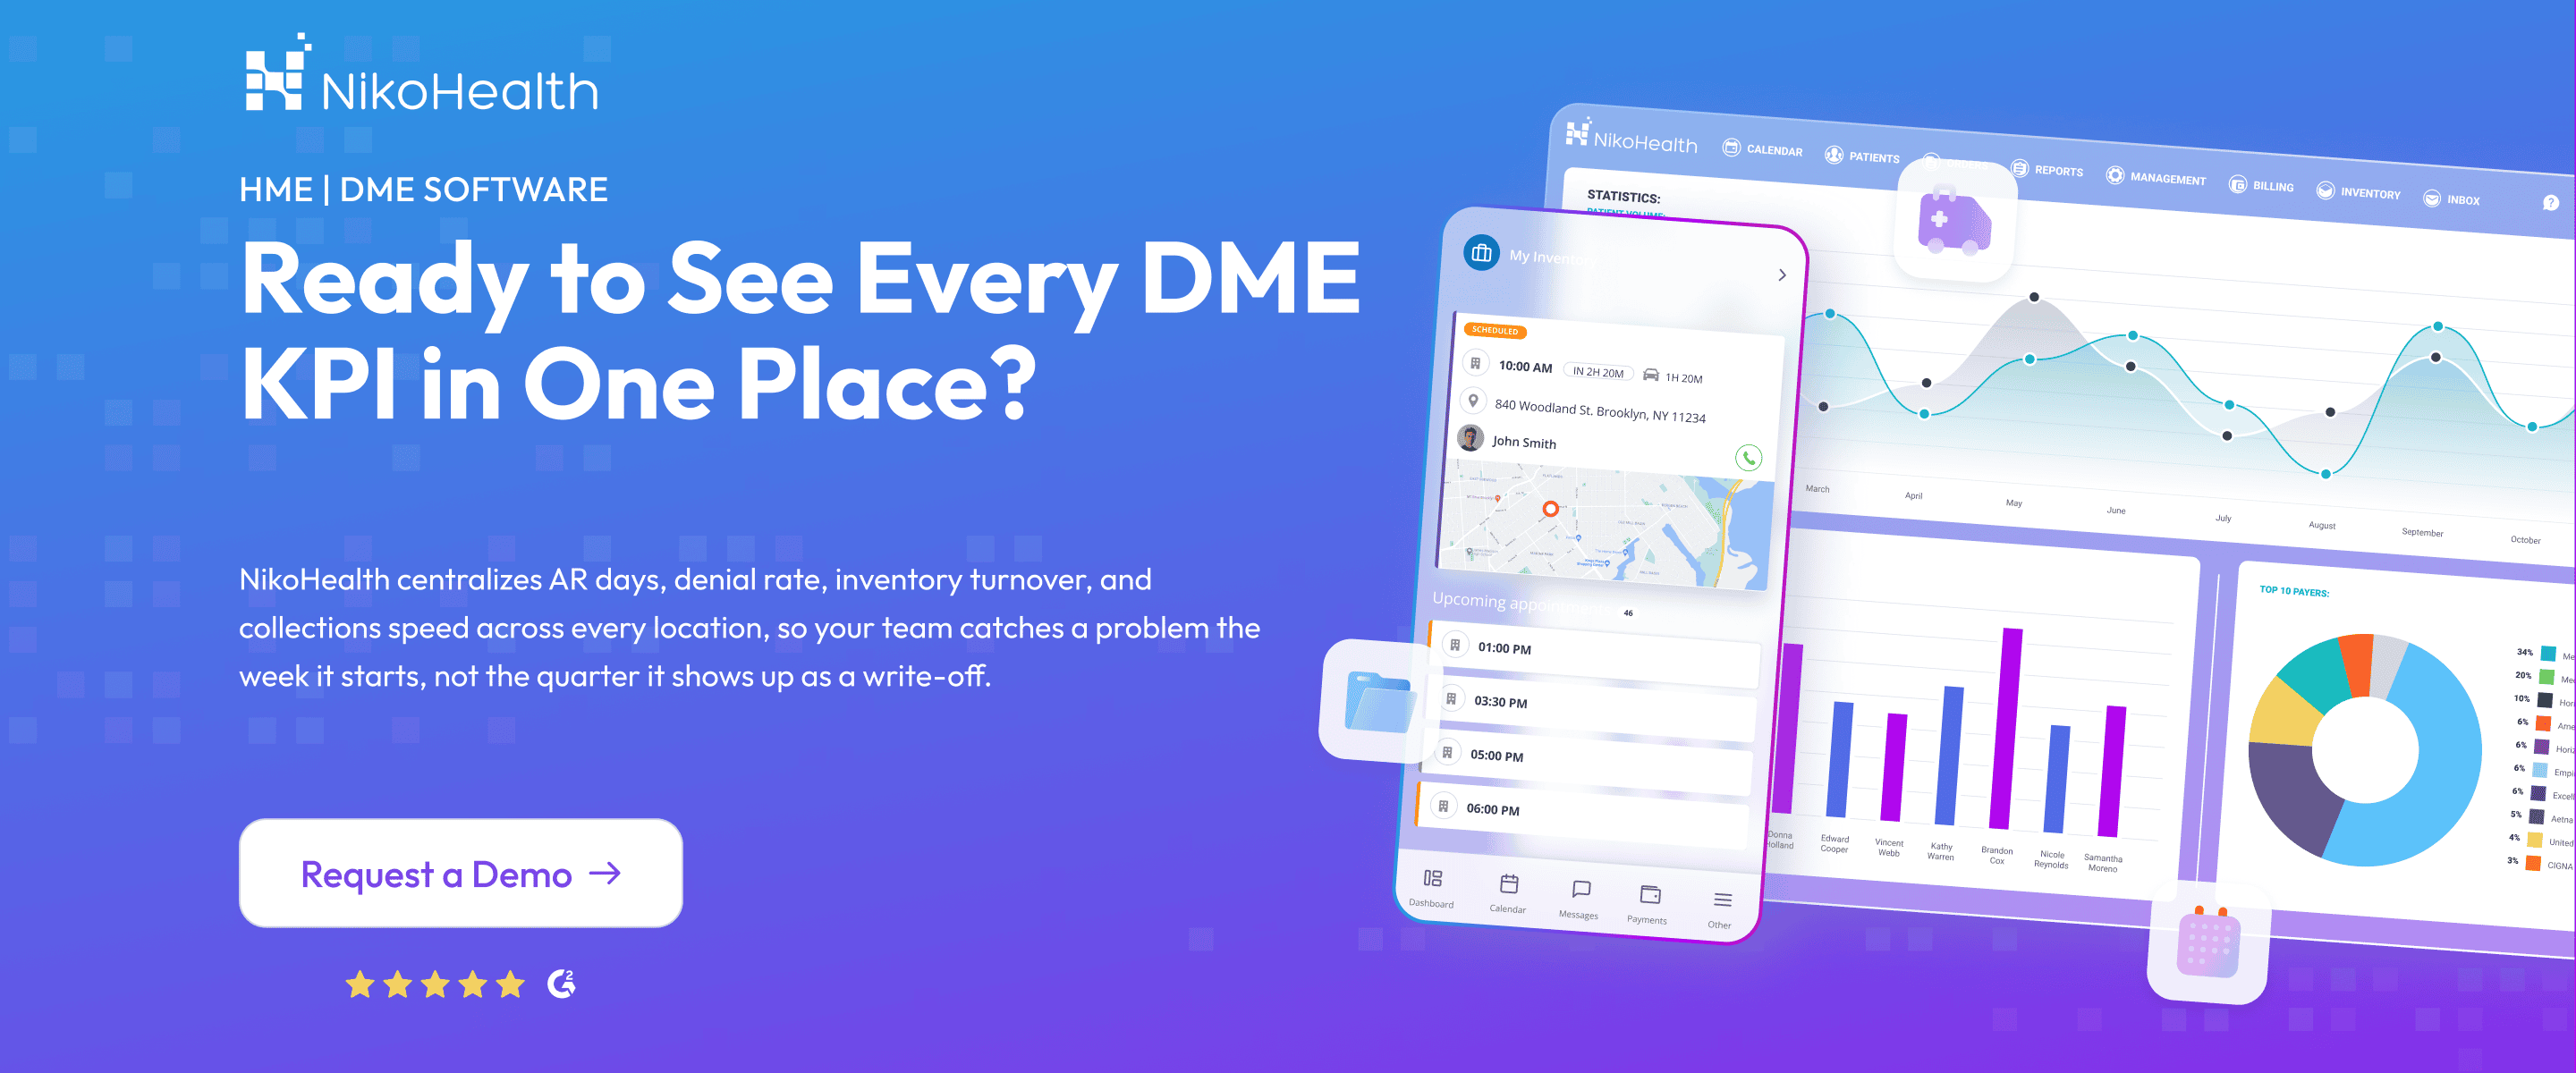
This is the layer NikoHealth’s analytics and reporting module is built to cover: revenue cycle dashboards showing claims, payments, denials, and outstanding balances in real time, alongside inventory KPIs and order metrics, broken out by site. For providers evaluating whether their current platform can support that level of visibility as they add locations, enterprise DME software built around a single system of record is the more direct path than layering a reporting tool on top of disconnected systems. The dashboards give the team you already have the visibility to catch problems in week one instead of quarter three.
If your current view of these five KPIs depends on someone manually pulling four reports together, that’s the gap worth closing first. See how NikoHealth’s platform brings billing, inventory, and reporting into one view.
FAQs
How often should operations directors review DME KPI dashboards?
Denial rate and clean claim rate are worth reviewing weekly, since patterns are easiest to act on before a backlog builds. AR days, inventory turnover, and collections speed are typically reviewed monthly, with location-level detail available on demand.
Can DME analytics dashboards break KPIs down by individual location?
Yes, when the platform is built for multi-location operations. NikoHealth’s reporting shows revenue cycle and inventory KPIs at the enterprise level and by individual site, so an operations director can tell whether a denial spike or AR slowdown is systemic or isolated to one location.
Why does inventory turnover matter to a billing team, not just operations?
Rental billing is tied to equipment status. A return that isn’t logged promptly can mean billing continues after a patient no longer has the equipment, or that equipment sits unavailable for redeployment because it was never marked returned. Inventory and billing accuracy are connected metrics, not separate departments’ problems.
What’s the fastest way to improve collections speed without adding billing staff?
Automating the steps that create delay before staff touch a claim (eligibility verification at intake, pre-submission claims scrubbing, and automated remittance posting) typically moves collections speed faster than adding headcount. In-Home Respiratory’s 20% improvement came from removing manual touchpoints in the billing workflow, not from expanding the team.


Related Articles